Last time, we talked about the constituents of candle line. Now, let’s move forward to see what kind of information candle line convey. In this article, Doji will be introduced and analyzed. Doji is a candle line where the opening and closing prices are the same. If the opening and closing prices are within a few ticks of each other, the line could still be viewed as a doji. Figure 1 shows what Doji looks like.
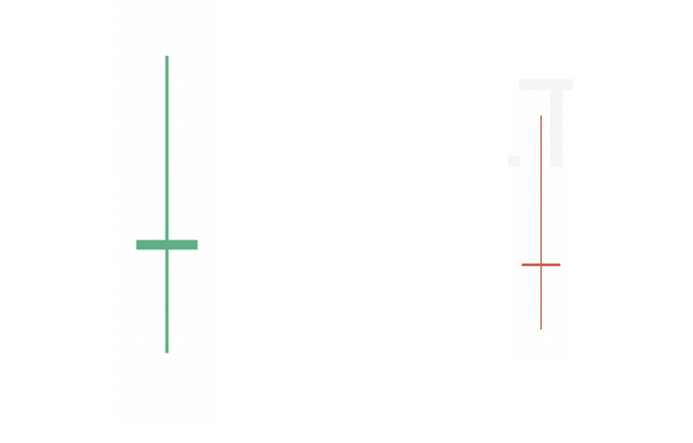
Figure 1: Doji
Doji indicate a balance between the supply and the demand, which represents indecision. Indecision, uncertainty, or vacillation by buyers will not maintain a rally. It is a distinct trend change signal, especially during rallies. The likelihood of a reversal with the emergence of a doji increases if:
- The market is overbought
- The doji is right after a tall green candle.
Some analysts believe that once these two conditions are satisfied, the market is “tired”and “vulnerable, and may be at a transition point.
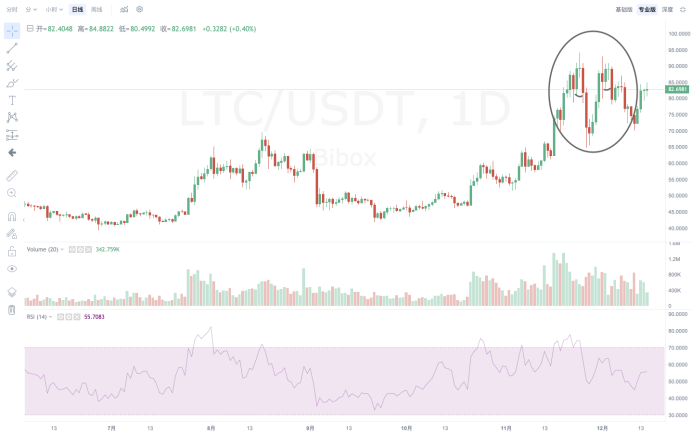
Figure 2 shows the daily LTC/USDT candle lines. After a continuous rise,
a doji appeared right after a long green candle line appeared on Nov.23. At this time, the price of LTC has reached a new high, and the RSI index also shows that the market has entered an overbought state, which indicates that the market has a great probability of falling. Well, the fall did happen. The price of LTC decreased in the three consecutive days.
Similarly, a doji in a rally showed on Dec. 3rd , with a longer green candle on Dec. 2nd. Although the RSI did not enter the overbought zone on December 3, the price of LTC was also at a peak at this time and it did not break the previous resistance level. The early warning signal of doji was verified here again, forming a wave of decline to Dec. 11th.
Anyway, doji are valued for their ability to call market tops. This is especially true after a long green candle in an uptrend. However, if the closing is higher than the resistant level, the likelihood that buying forces take over the market again increases. We call a doji in a rally Northern doji
Doji tend to lose reversal potential in downward trends. The reason maybe that a doji reflects a balance between selling and buying forces. With ambivalent market participants, the market could fall. We call a doji in a decrease Southern doji. We need more other signals to confirm the reverse when a Southern doji shows.
One more thing to be addressed is that if there are numerous doji on a particular chart, one should not view the emergence of a new doji as a meaningful development. One should observe the significant of a Northern doji as reverse signals in your interested token charts. For different tokens, the power of doji differs. All of the candle lines or patterns may be effective in the cryptocurrency market or only some. Experience will tell you in which token they work well.
You can study LTC/USDT candle lines here:
https://www.bibox.com/v2/exchange?pair=LTC_USDT
You can find all trading pairs’ candle lines on Bibox:
https://www.bibox.com/en/exchange
Bibox has a quantitative trading group where different trading strategies and tools are discussed. You may join it here:
https://t.me/bibox_trading_bot